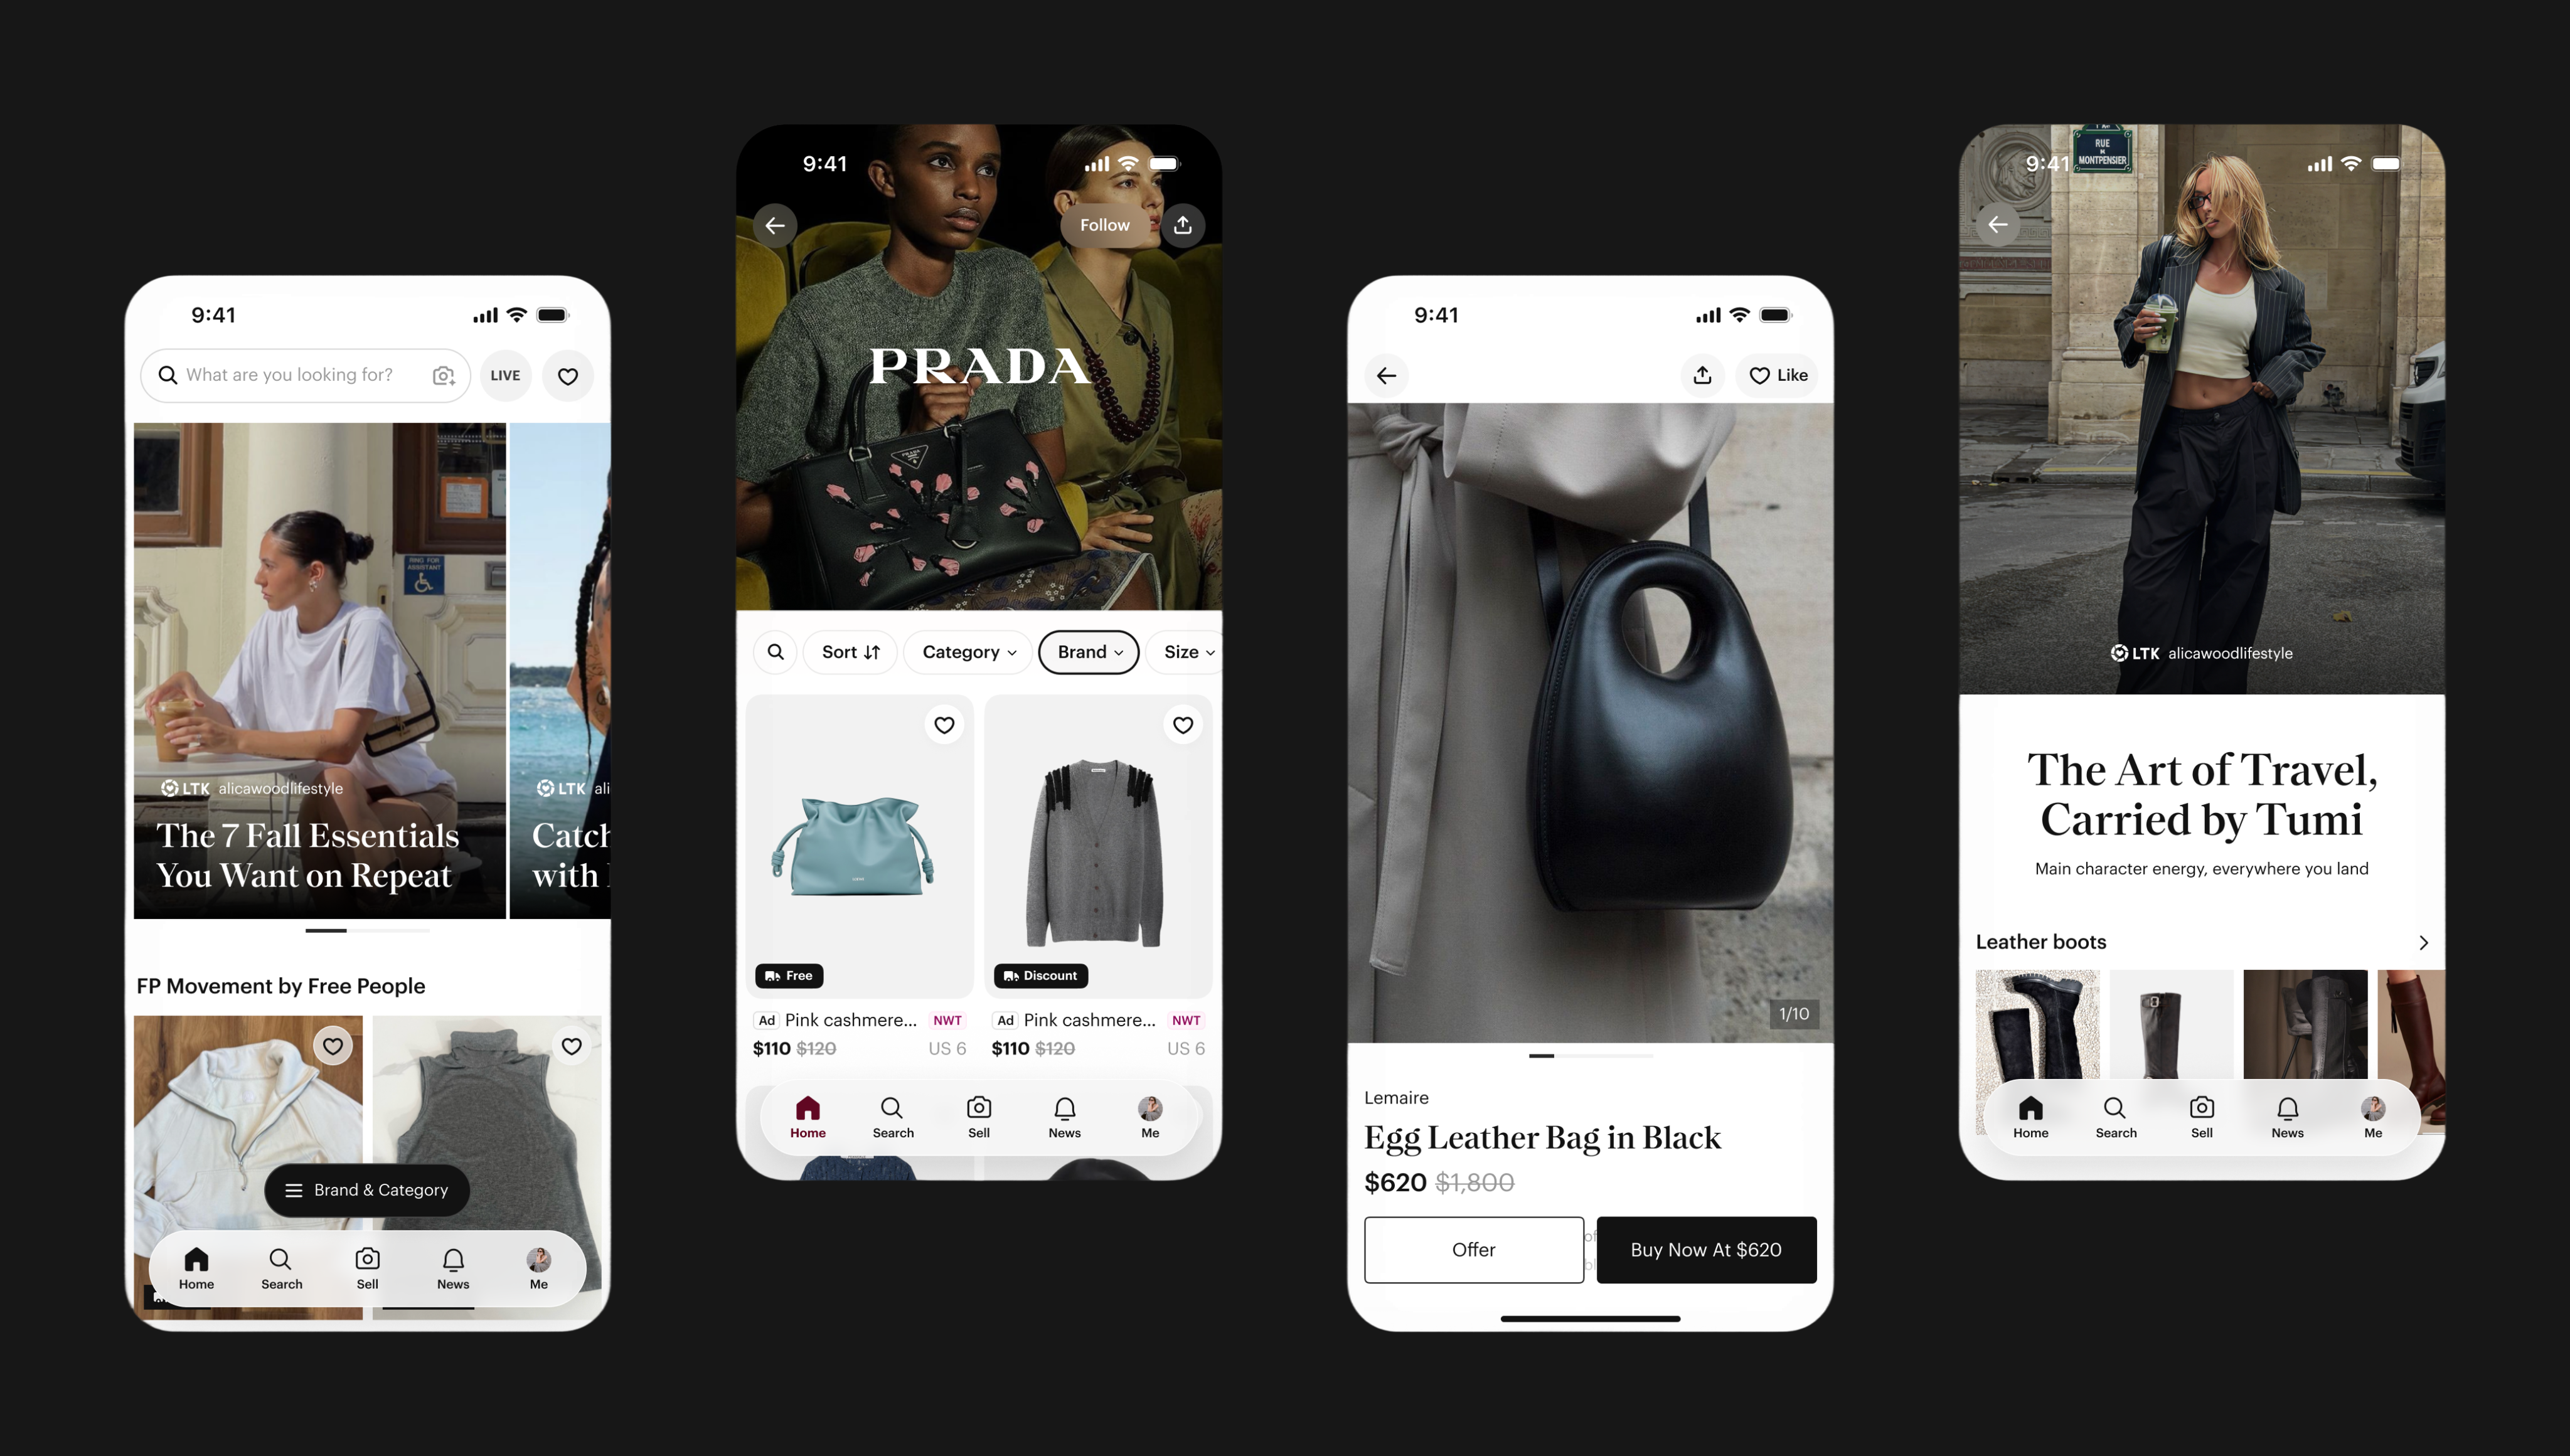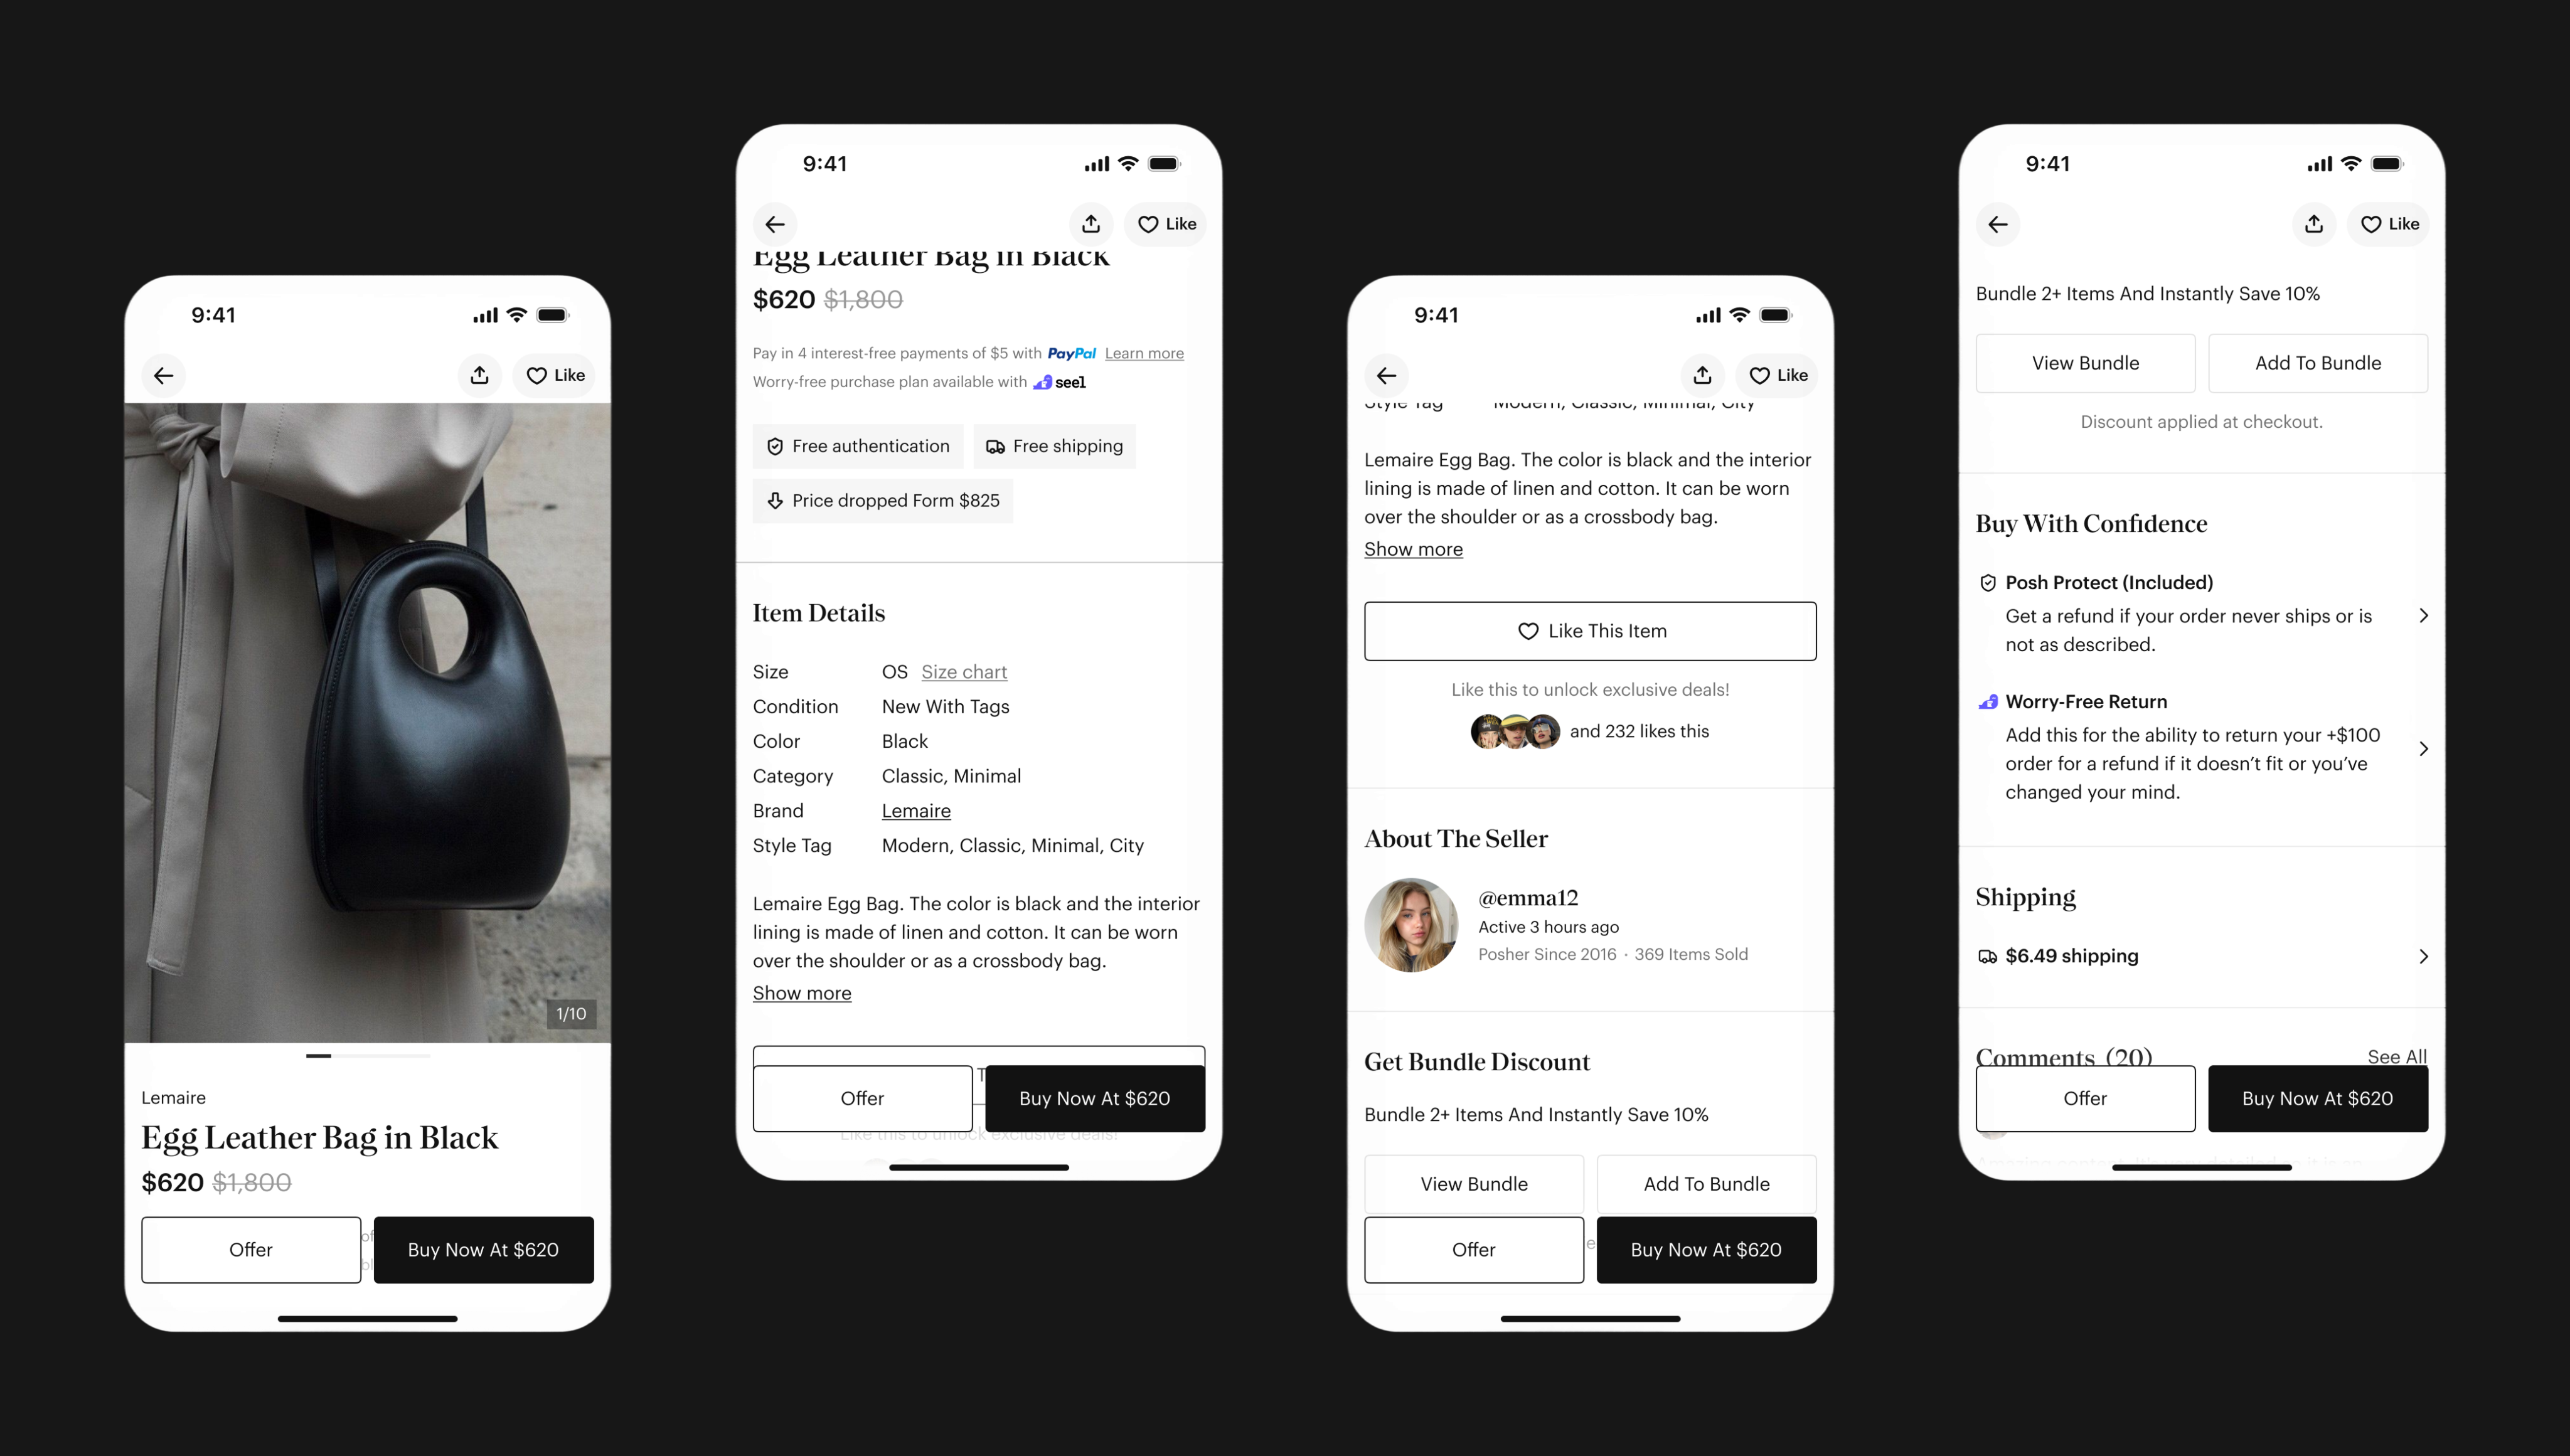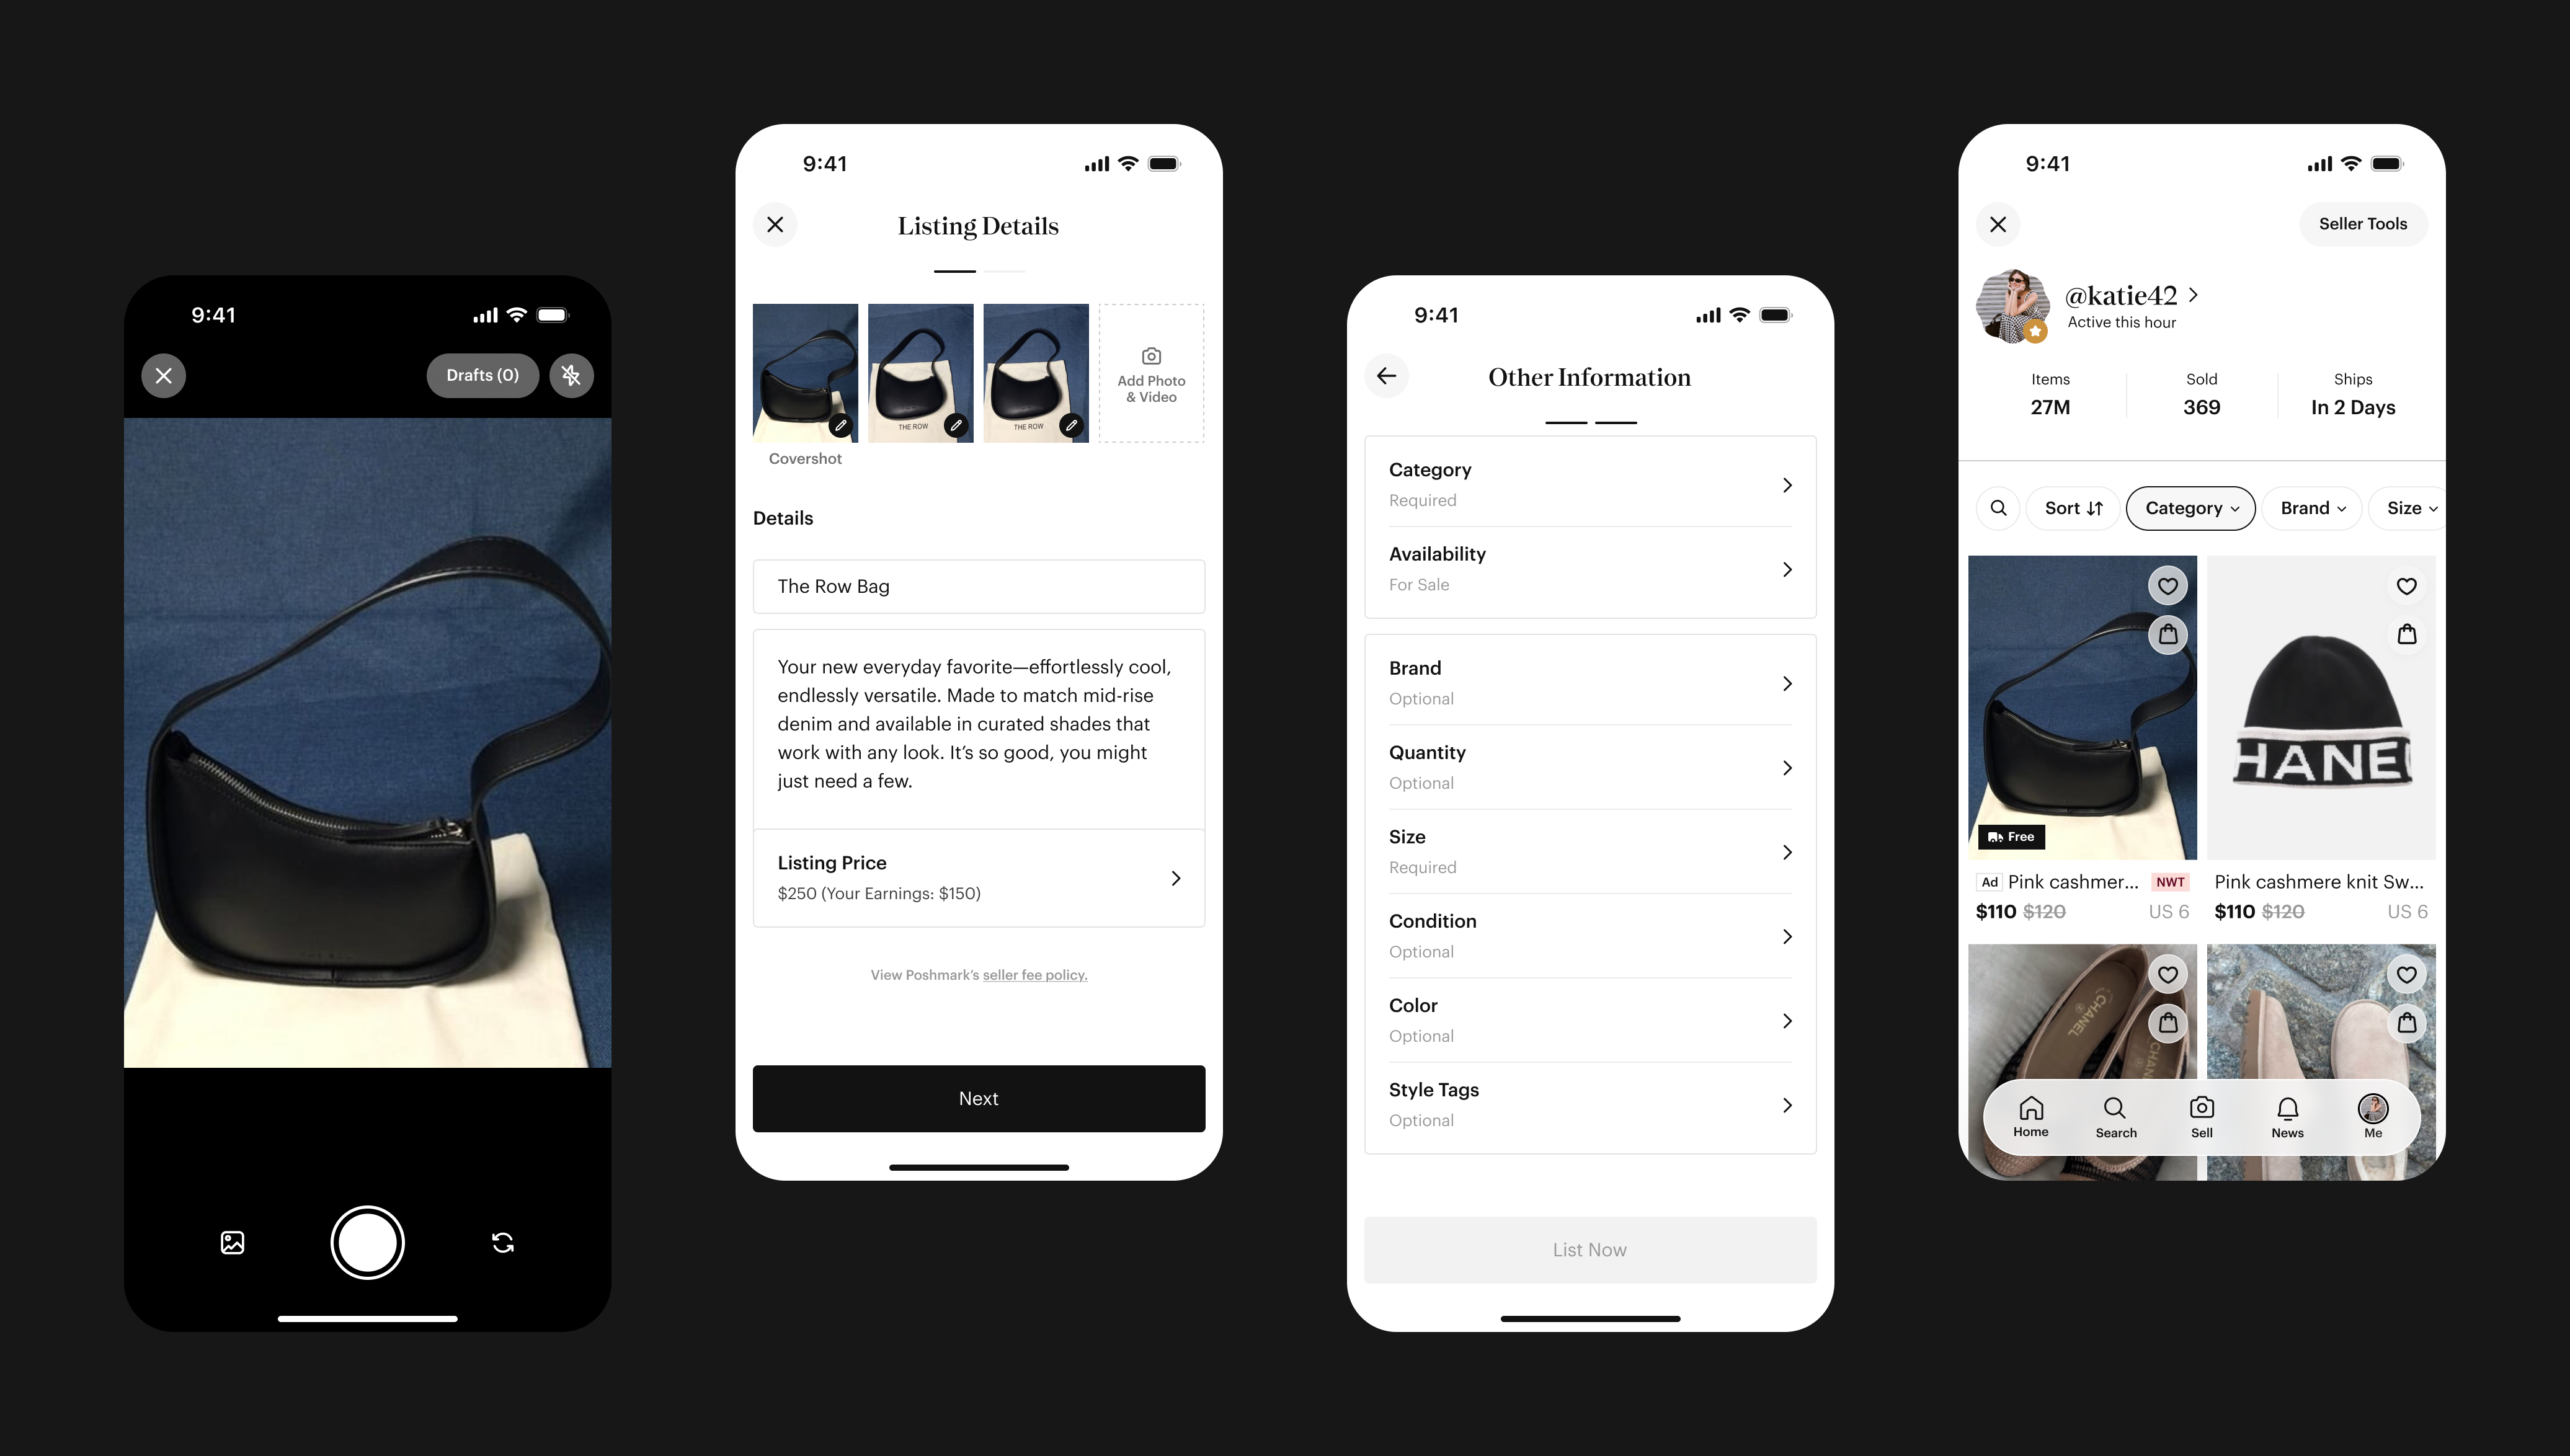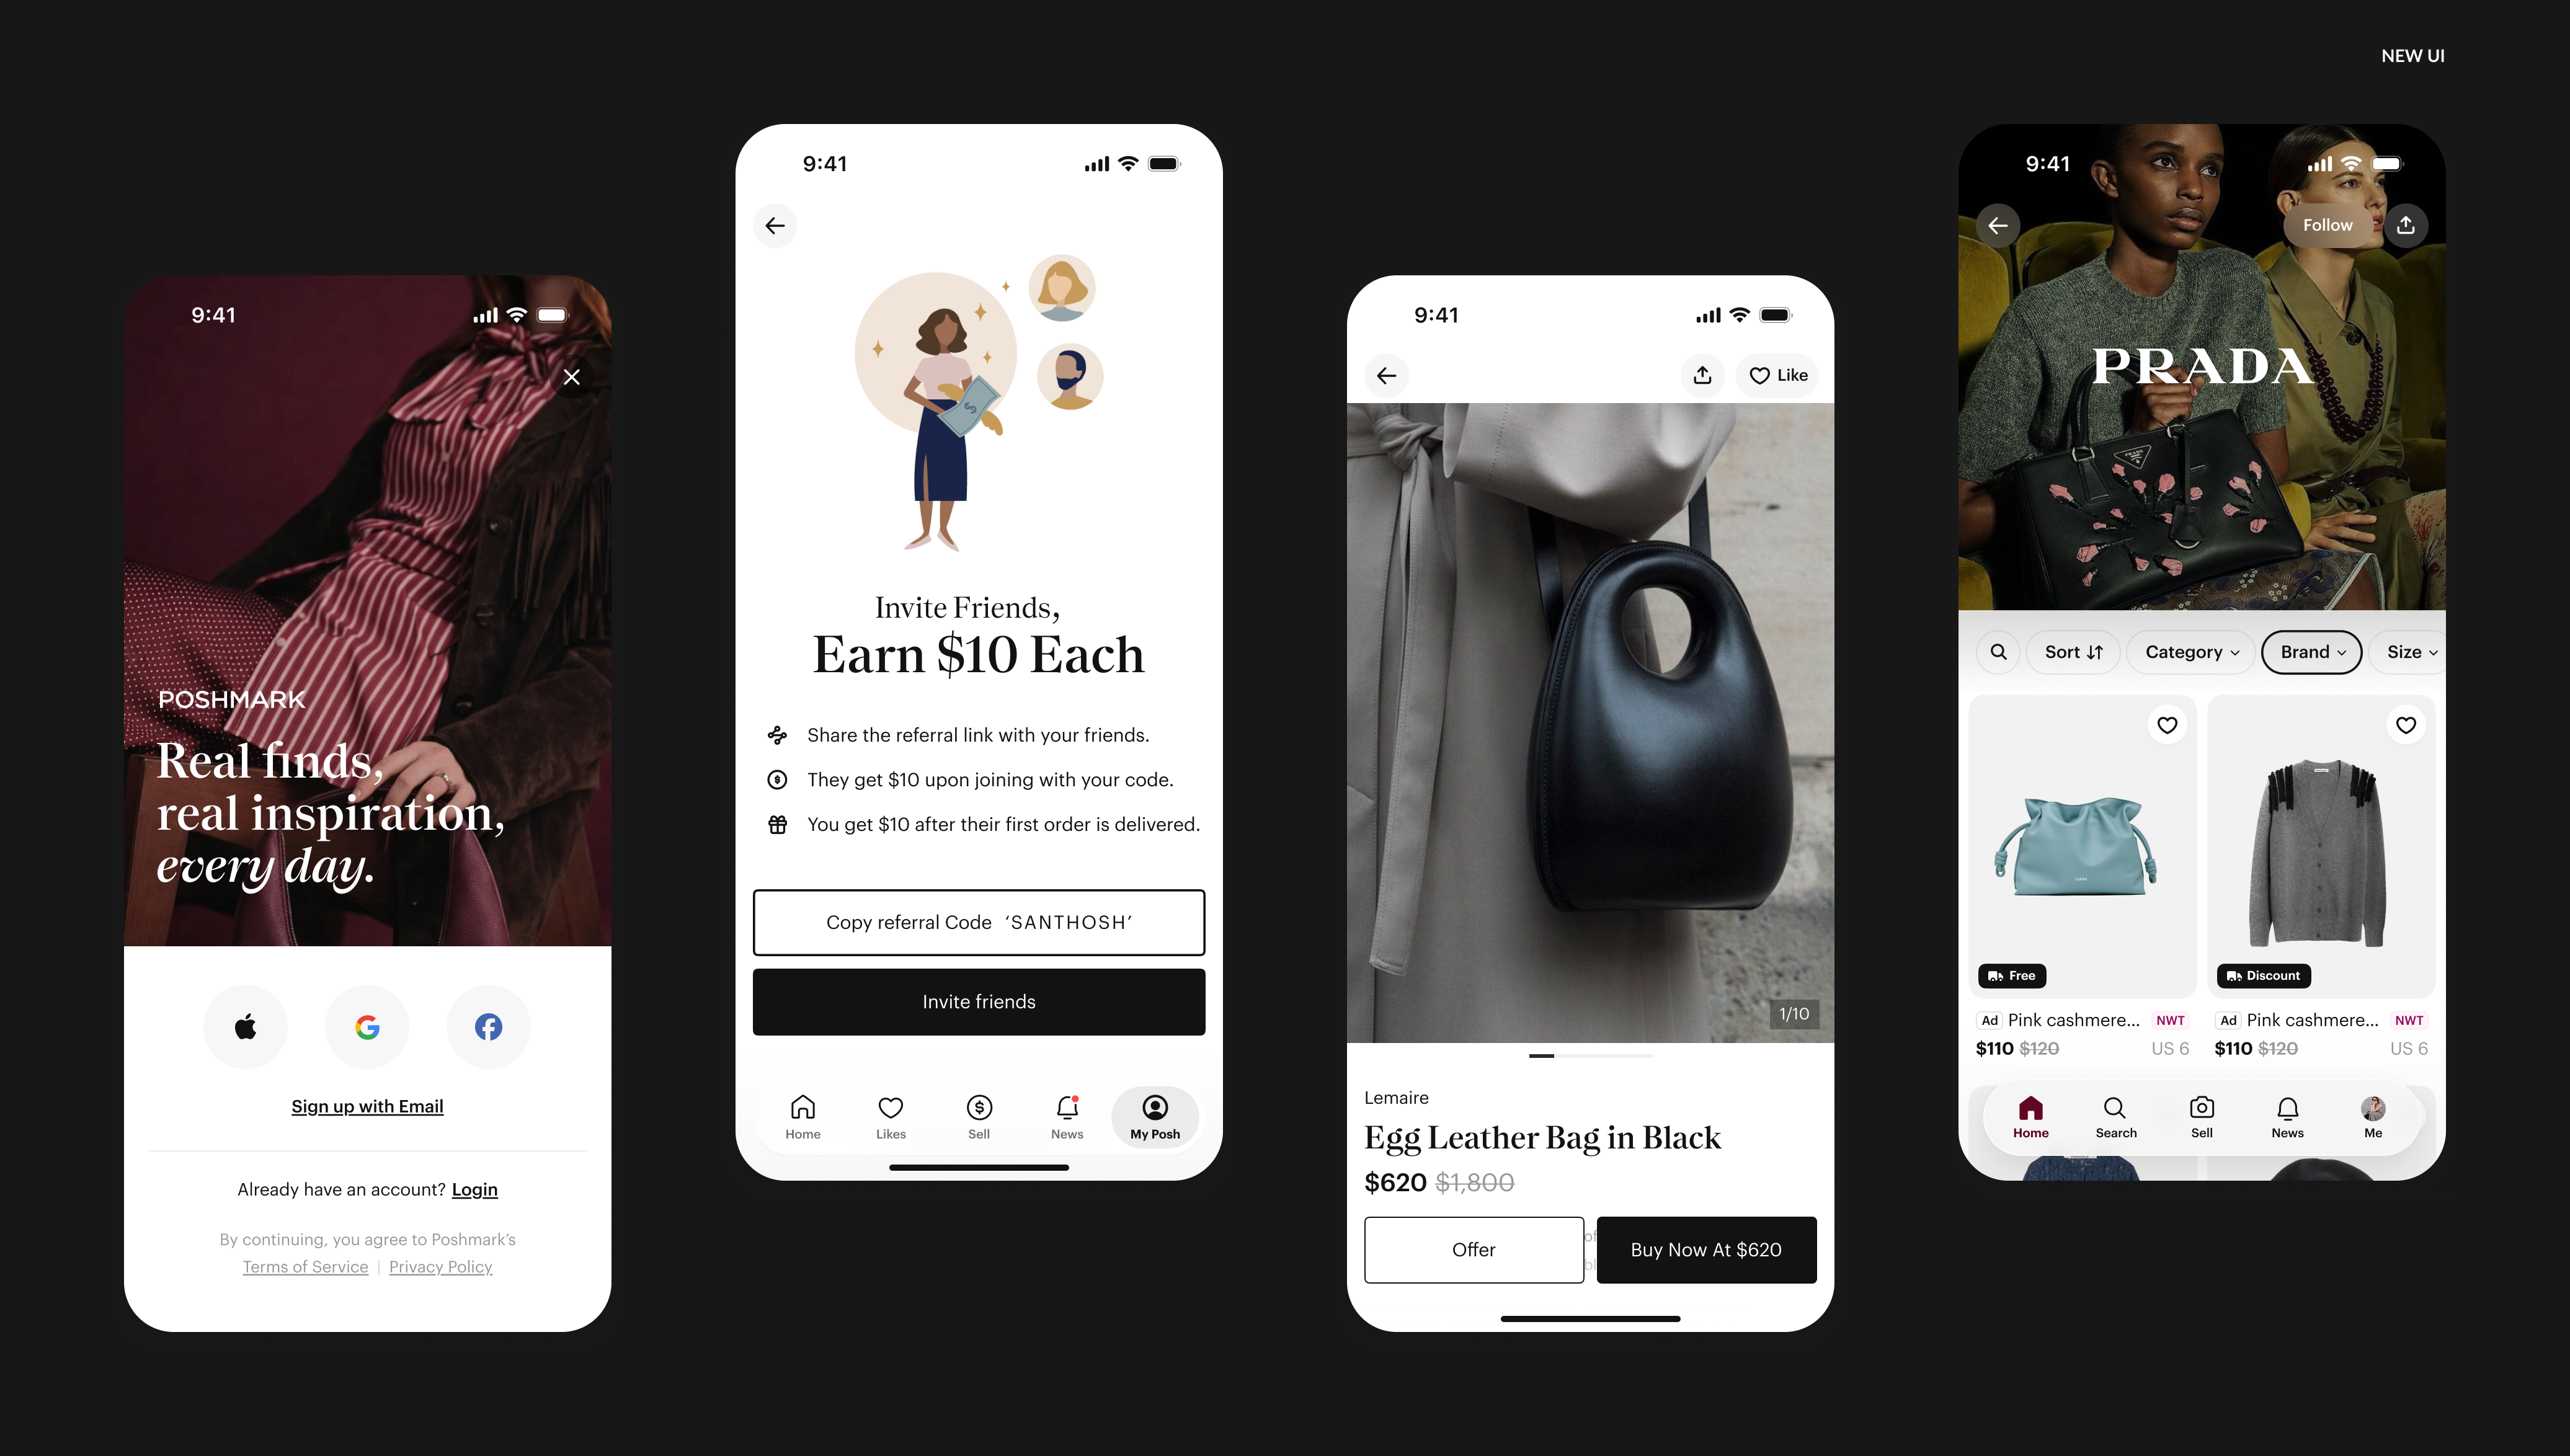
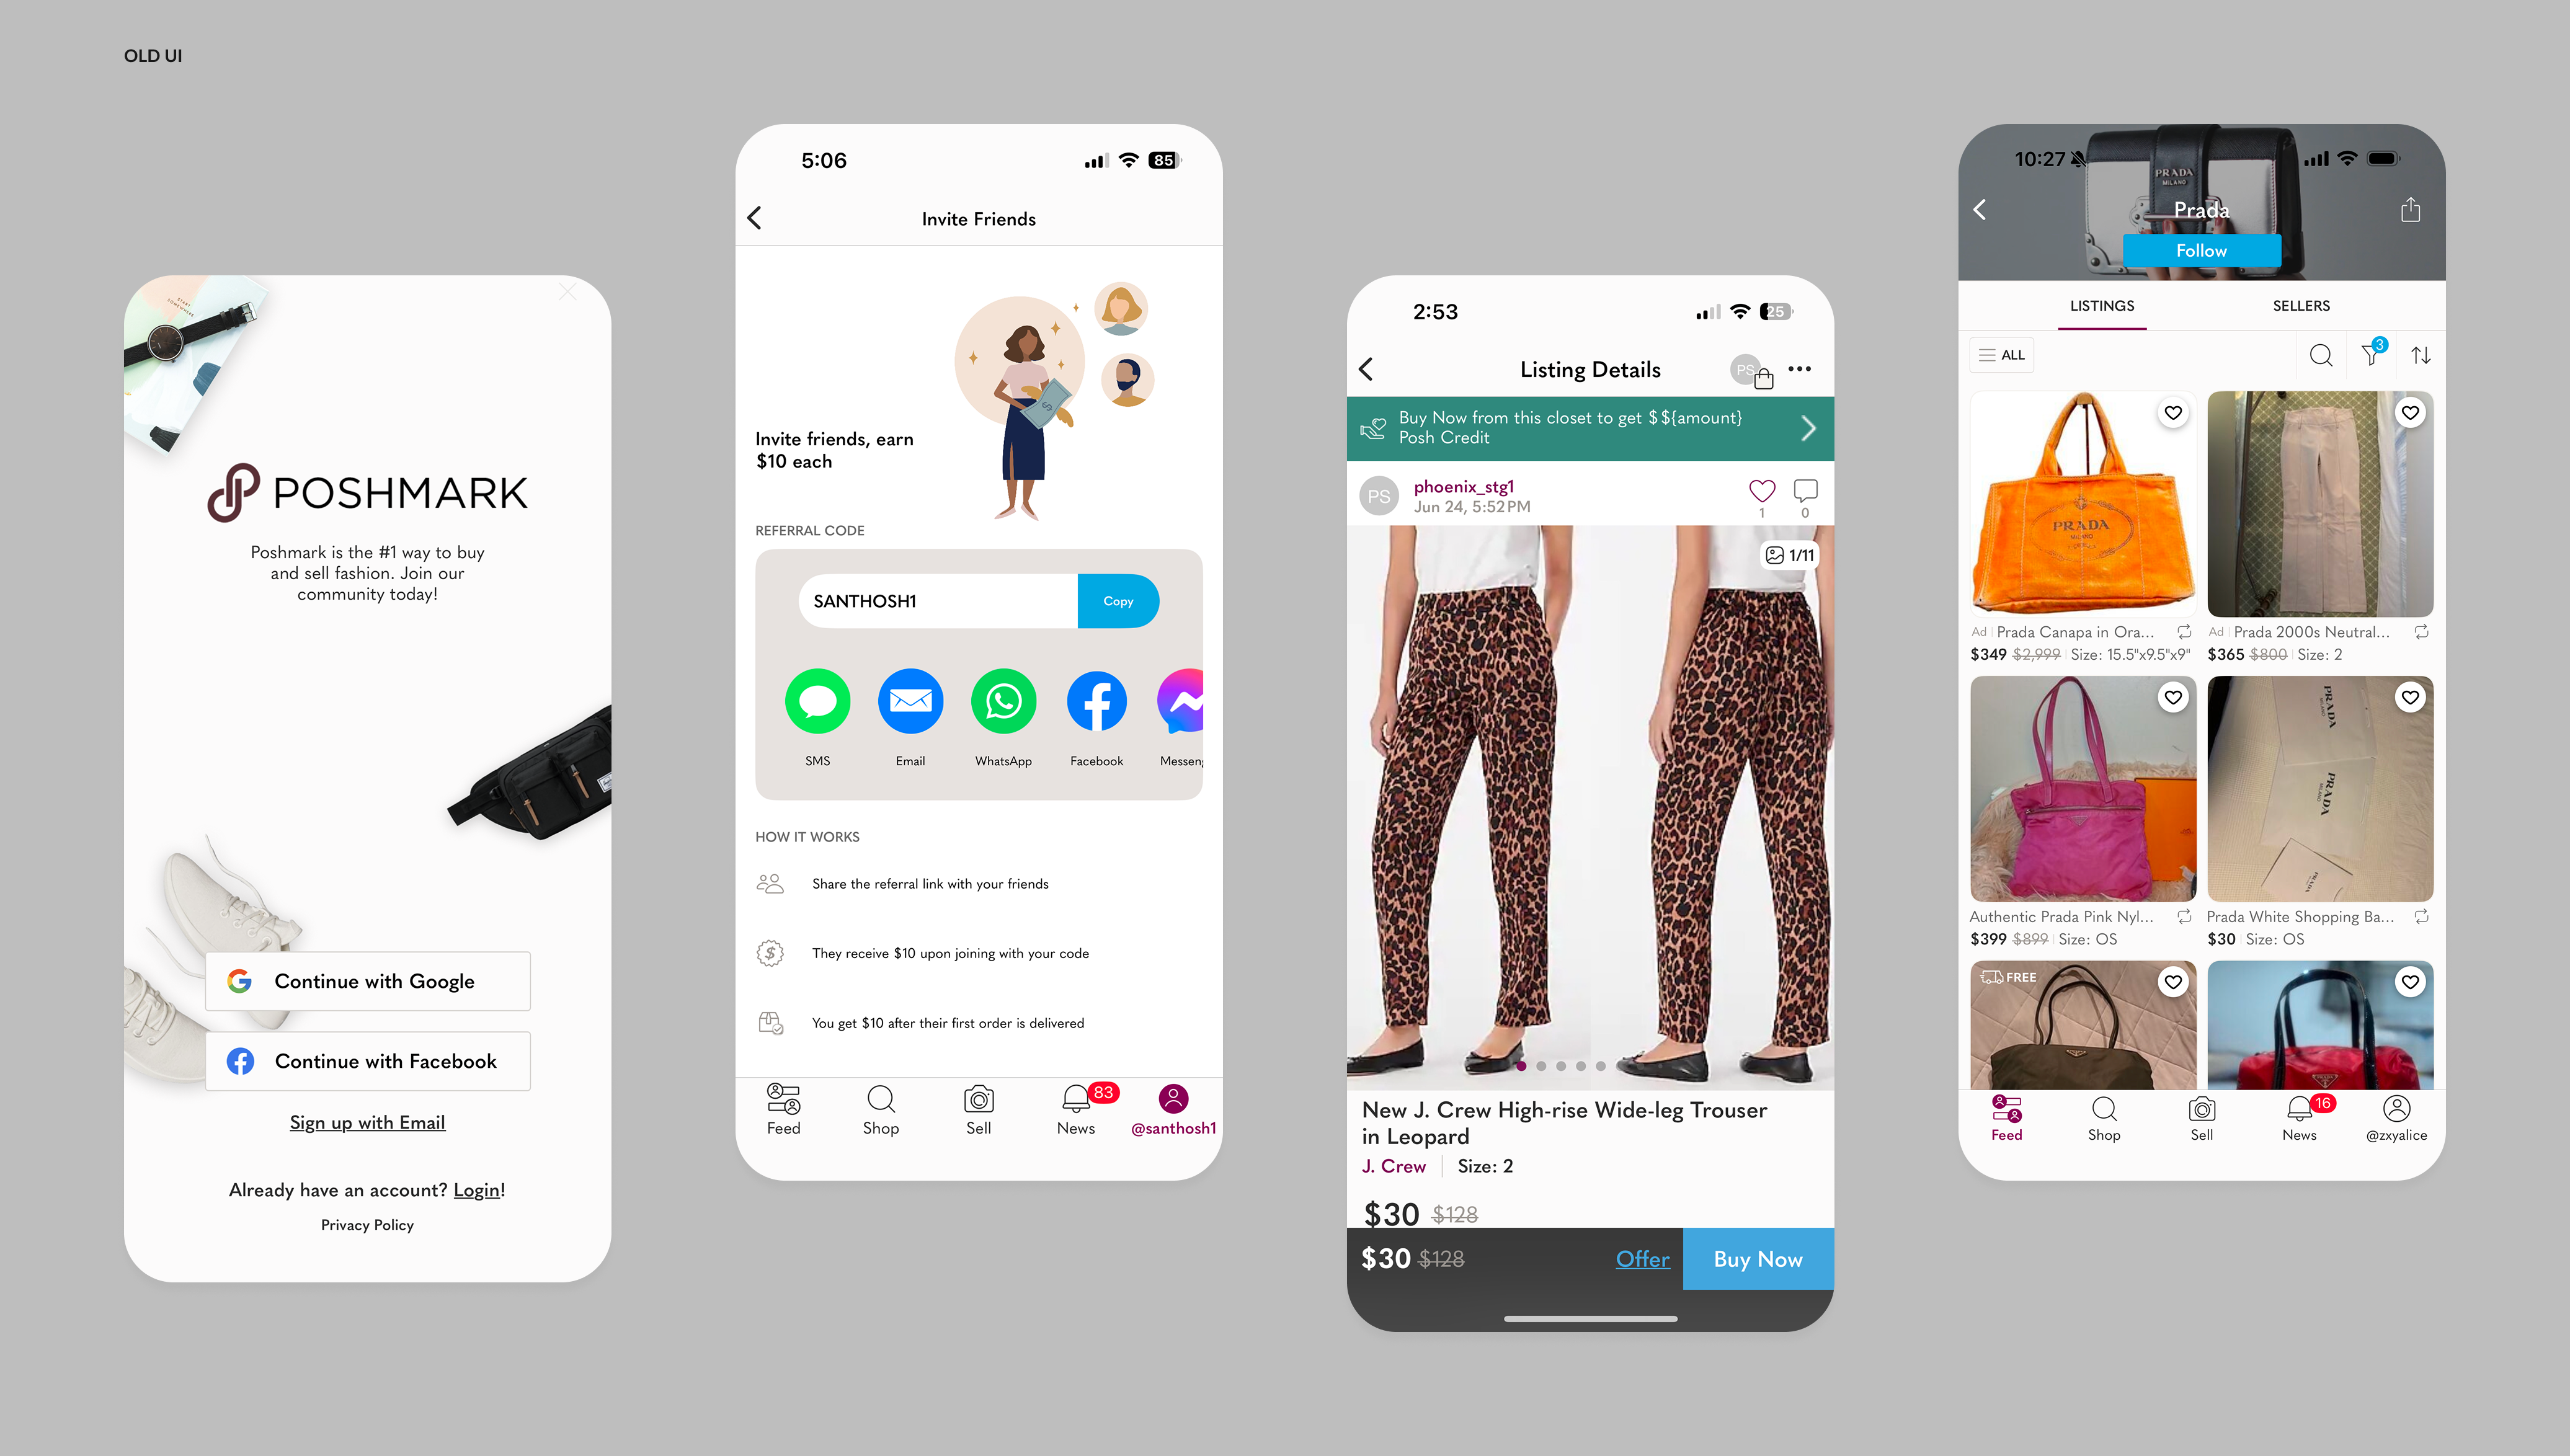
Slide to compare
Poshmark · App Redesign
Fifteen years of product debt, a shrinking seller base, and a rare engineering window. The design strategy, trade-offs, and outcomes behind Poshmark's most significant platform investment in a decade.
Poshmark operates a two-sided marketplace. Every design decision impacts both supply and demand. When sellers struggle to list, inventory shrinks. When buyers can't discover relevant items, conversion drops. When conversion drops, seller confidence falls - and the cycle compounds.
By FY2025, that cycle was working in reverse. DAU was declining, Gen-Z acquisition was lagging, and Depop and Vestiaire Collective were gaining ground on the core seller demographic. Over the years, Poshmark had expanded into live commerce, advertising, seller tools, and community features - each valuable in isolation, but together creating a product that was increasingly hard to understand and harder to use.
A new engineering platform created a rare window to address this at scale. The challenge wasn't visual modernization - it was rebuilding the experience to reinforce the marketplace flywheel: more sellers → more inventory → better discovery → higher conversion → increased revenue → more sellers.
The platform had lost its edge. We were losing sellers faster than we were acquiring them, and no single feature fix was going to move the needle - the entire experience needed a rethink.
New users couldn't understand what to do first. Feature sprawl from years of additive roadmaps had made the core value proposition hard to find. Every percentage point lost at activation represented thousands of buyers and sellers who never reached marketplace value.
The majority of Poshmark's inventory comes from casual sellers - not power sellers. Many arrived with intent to list but abandoned before completing a single listing. Without supply, demand has nothing to convert against. Supply creation was the highest-leverage point in the entire funnel.
Multiple teams had optimised for feature visibility. The result was a navigation that reflected internal ownership, not customer goals. Users spent more time deciding where to go and less time doing the things that generate revenue - listing, browsing, buying.
We had tried feature-level fixes for three consecutive cycles. Each one moved a metric in isolation without shifting the broader trend. The data was clear: the problems were systemic. Seller activation, discovery relevance, and visual trust were all failing together - and a new engineering platform had opened a window to address all three at once. Incremental was no longer an option.
Slide to compare
I owned the end-to-end design direction for the redesign - from north star definition through to launch. My role spanned hands-on design work on the core strategy and flows, stakeholder alignment across Product and Engineering, and leading a team of four designers across the full surface area. Every significant design decision on the initiative ran through me.
That was the strategic lens. Instead of asking "how can we improve this screen?" we asked "how can we make buying and selling feel easier?" Every design decision - feature prioritisation, information architecture, component investment - was evaluated against its impact on marketplace participation, not interface quality alone.
We translated this into three pillars, each mapped directly to a marketplace health lever.
Poshmark's casual seller retention had fallen to 22% - not because sellers stopped wanting to list, but because the experience made them quit before publishing. Reduce that effort and supply recovers. More supply improves selection, which improves buyer conversion. Listing experience was the highest-leverage point in the flywheel.
Poshmark's feed was built around social follows - who you know, not what you want. As Gen-Z buyers moved to platforms with intent-based discovery, repeat visits were declining. Feed personalisation based on browsing behaviour, style signals, and purchase history - not just social recency - was the path back to relevance.
Fashion resale has no fitting room. Buyers judge condition, authenticity, and seller reliability from photos and a reputation score. Poshmark's community ratings and peer evidence were underutilised - buried below the fold where they couldn't influence the decision moment. Surfacing them without adding visual noise was the conversion gap to close.
Prioritise supply creation first. Without inventory, discovery improvements have nothing to surface and conversion improvements have nothing to convert. The listing redesign was the highest ROI bet - fastest to validate, and the change that unlocked internal momentum for the full platform rollout.
Goal-centric navigation and behavioural personalisation addressed the demand side - more relevant discovery, higher session depth, improved repeat purchase. The design system wasn't a design deliverable; it was platform infrastructure, enabling 4 product squads to build faster and more consistently across every future cycle.
We ran a mixed-methods research programme in partnership with Data Science and Research. Quantitative signals came from session analysis, funnel abandonment studies, navigation path analysis, listing completion analytics, and marketplace conversion trends across millions of visits. Qualitative signals came from buyer and seller interviews, new-user studies, and diary studies. Not all findings shifted priorities - but the ones that did fundamentally changed the sequencing.
We had initially planned to optimise the listing experience for first-time casual sellers. The marketplace data changed that call. Power sellers were not an edge case - they were the economic backbone. Designing for the 95% would have improved onboarding metrics while potentially degrading the experience for the users keeping the marketplace alive. Concretely: bulk listing shortcuts, pricing controls, and inventory management surfaced prominently for recognised power sellers. For first-timers, these revealed progressively after their first successful listing - reducing cognitive load without removing capability. One product, two experiences, served through progressive disclosure.
The prevailing assumption was that a shorter listing flow would improve completion. Session recordings showed the real pattern: sellers were dropping out before they reached the fields at all. The friction was at photo upload - slow, unreliable, and progress wasn't preserved on failure. Reducing step count without fixing this would have shipped a faster path to the same exit point. The fix required infrastructure work, not just flow redesign.
Buyers consistently surfaced search and discovery as pain points. We made a conscious decision to deprioritise this from Phase 1. The logic: without supply, better discovery is irrelevant. Seller activation had a 4x higher return than buyer-side improvements in the current state of the marketplace. We documented the requests and committed them formally to Phase 2 rather than letting them dilute Phase 1 focus.
Feed personalisation ranked as a top-3 priority in analytics, but full algorithmic personalisation required 6 months of backend infrastructure we didn't have in Phase 1. We chose to ship a manually curated signal version deliberately - not as a fallback, but as a learning strategy. A live product generates real behavioural data; a design document generates assumptions. Two quarters of live signal data directly shaped the Phase 2 algorithm investment. We couldn't have specified it as accurately without this phase earning it first.

Every major direction was tested against at least one alternative. These weren't aesthetic choices - they were strategic trade-offs with measurable stakes on marketplace health.
Business problem: Navigation had been built by teams optimising for feature visibility, not by users trying to complete goals. The result was a tab bar that reflected internal ownership rather than customer intent - users spent time navigating, not doing. We had data showing navigation-related abandonment was among the top 3 exit patterns across the funnel.
There was no discernible logic or hierarchy tying the navigation together. We redesigned it around user intent - organising every feature around what users were trying to accomplish rather than which team owned it. We ran a controlled A/B test on a 10% traffic split for 2 weeks - success criterion was no regression in session depth, with improvement as the target.
Business problem: The homepage was attempting to serve four different user types simultaneously - new buyers, power buyers, casual sellers, and professional sellers. The result was an average experience for everyone and an optimised experience for no one. Conversion and repeat visit rates reflected this.
We considered building dedicated buyer and seller experiences. The risk: marketplace users frequently move between roles. A rigid segmentation model would add long-term product complexity. We chose behavioural personalisation instead - the homepage adapted dynamically based on shopping activity, selling activity, engagement patterns, and lifecycle stage. Flexible and scalable.
Business problem: The listing experience had been designed to collect comprehensive item data - good for search and recommendations, but the complexity was killing supply creation. Casual sellers were arriving with intent to list and leaving with nothing published. The marketplace benefits more from a completed listing than an abandoned perfect one.
We redesigned around momentum: AI-assisted product details, smarter defaults, progressive disclosure, and simplified photo capture. Step count went up on paper; perceived effort dropped significantly. The insight from testing: cognitive load matters more than step count. The goal was to make creating a listing feel like progress, not work.
Business problem: The existing Figma component library had grown organically across years of additive work - inconsistent naming, undocumented variants, and tight coupling to the old visual language. Extending it would have carried forward technical debt for every squad, for the duration of the 18-month rollout.
I positioned the rebuild as an operational investment, not a design project. The business case: a properly tokenised foundation would reduce design-to-development cycle time, eliminate cross-squad inconsistency, and make every future product cycle faster. We presented this at the executive level alongside the product roadmap - not separately as a design ask.
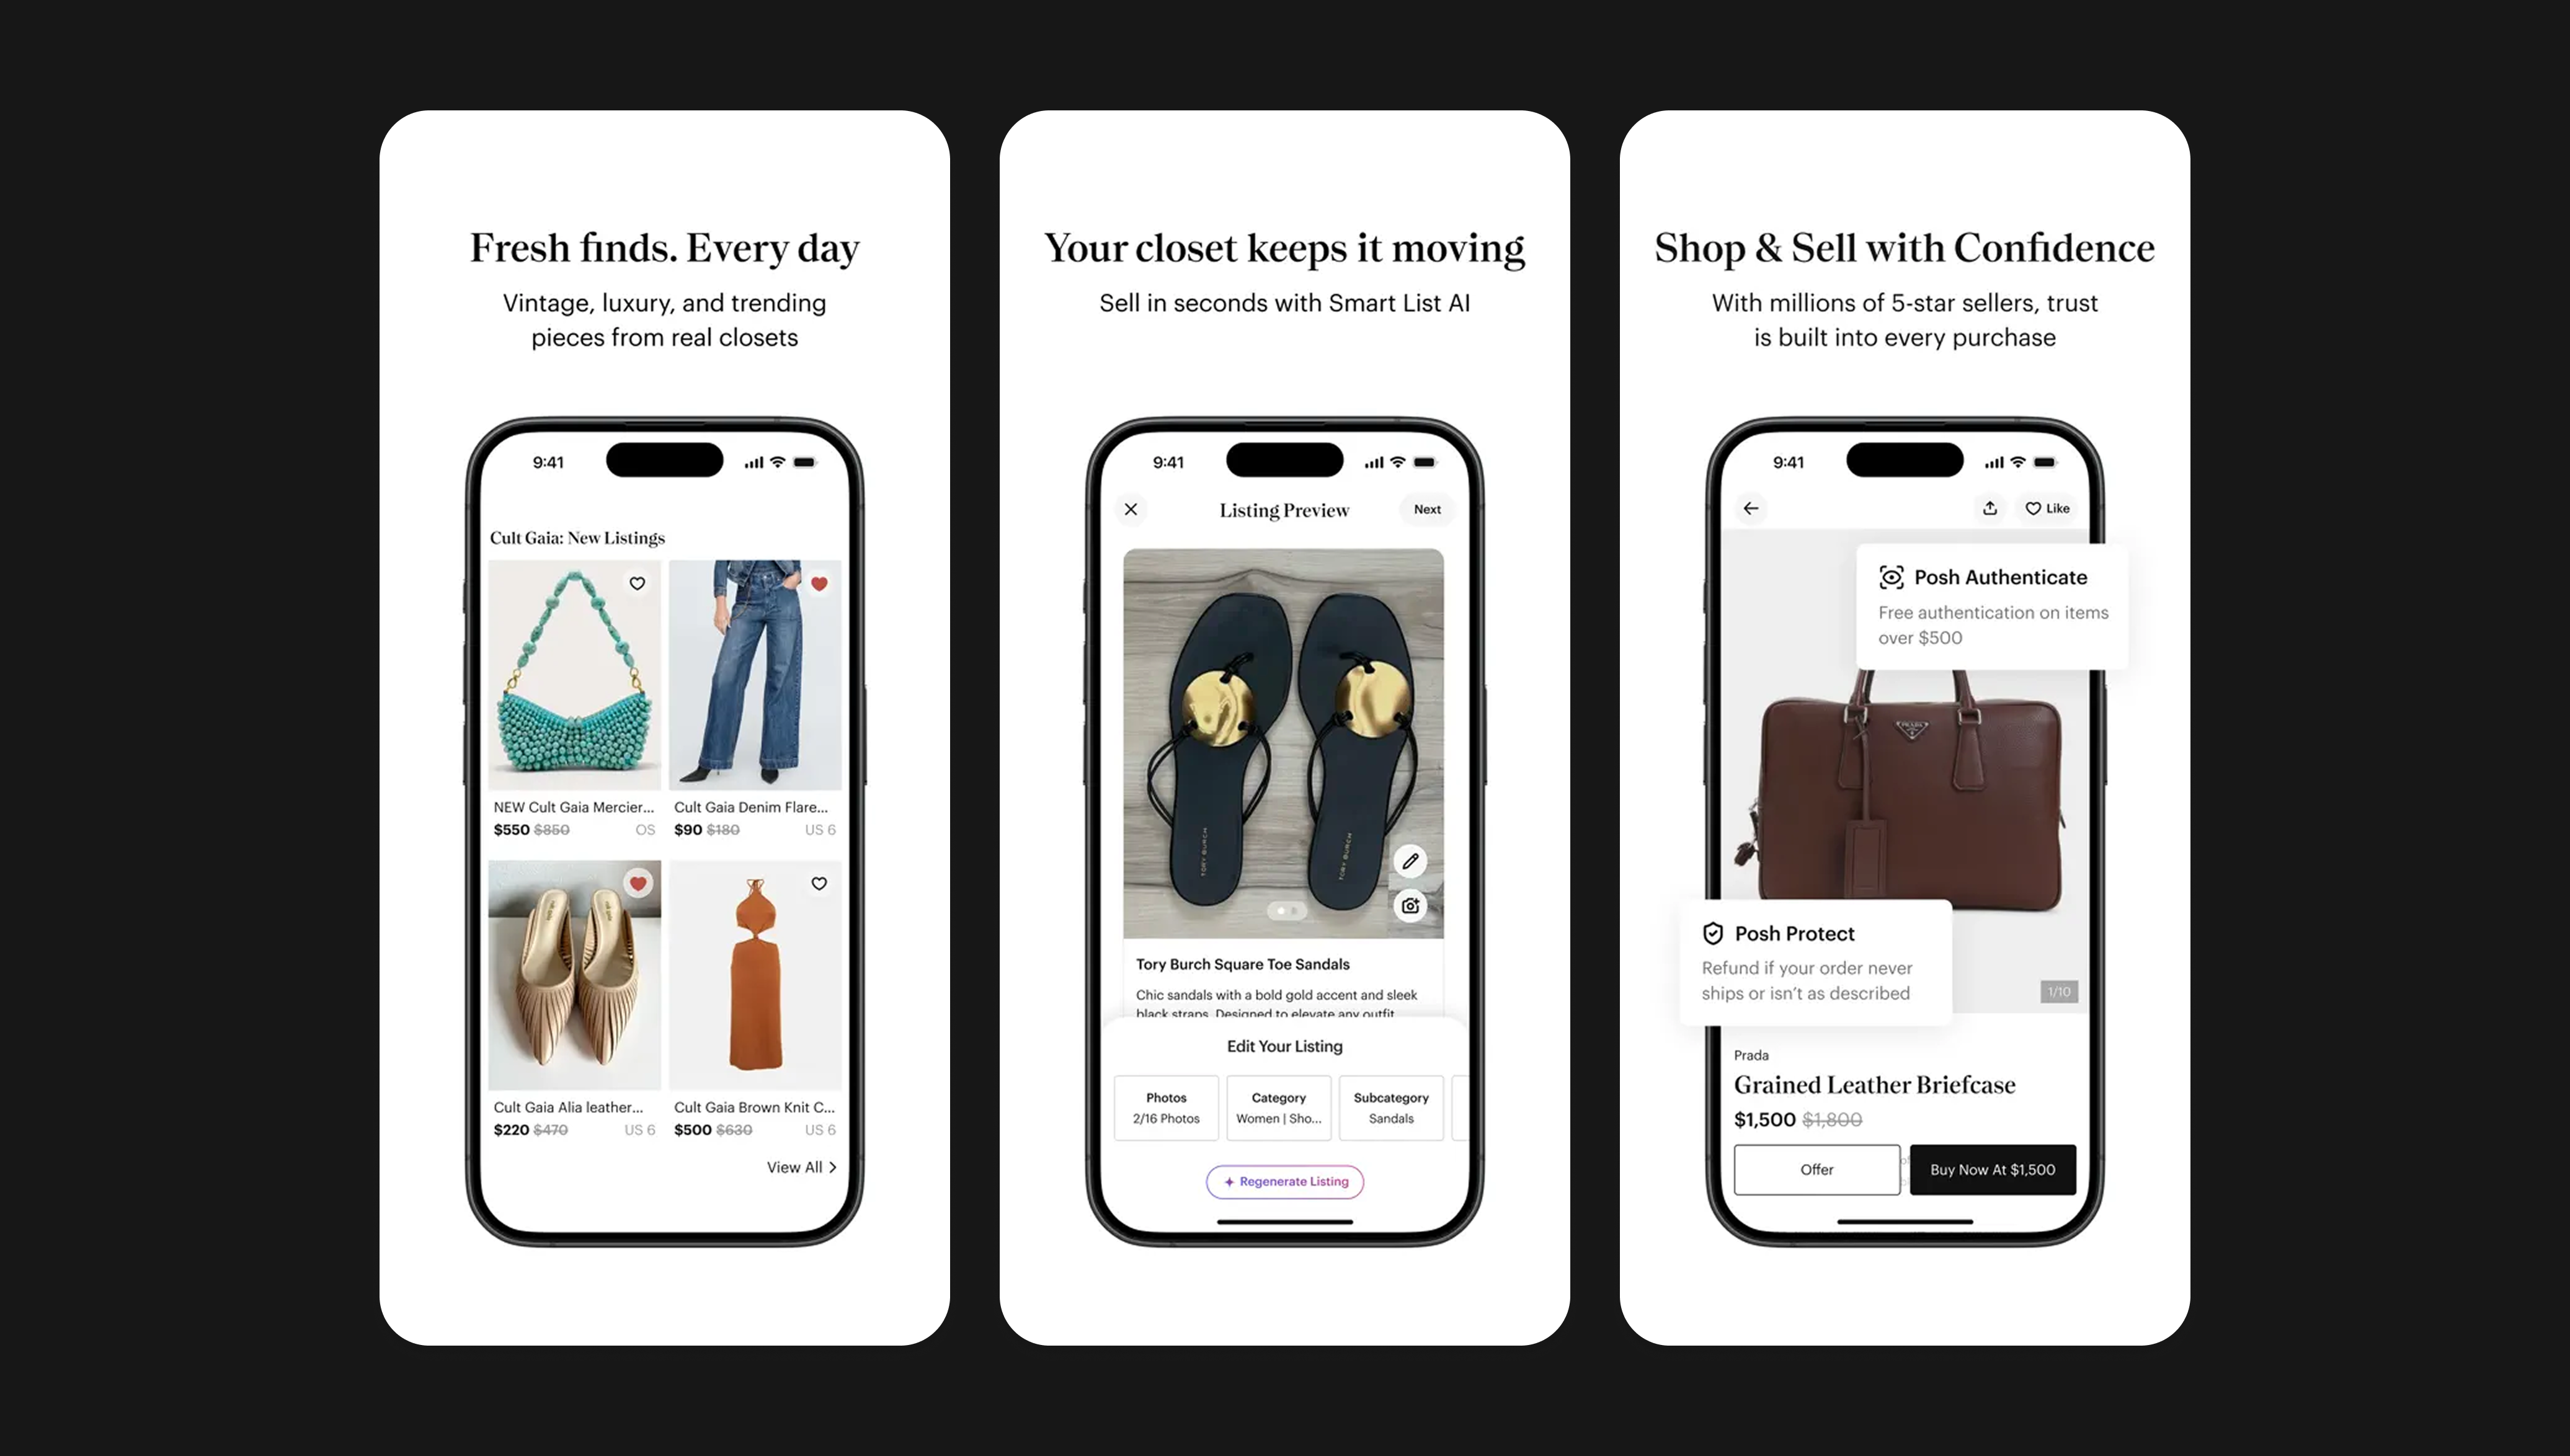
Each phase had explicit success criteria set before work started. Phases weren't arbitrary - they were sequenced so each one generated data that de-risked the next investment.
Success criterion: +20% listing completion vs. control. We shipped to a 10% cohort, held for 3 weeks, then ramped to 100% over 4 weeks. Result: +31% in the first 6 weeks, settling to a sustained +24% at steady state across the full cohort. The distinction matters - the early spike was real but cohort effects stabilised it. The sustained number is what we reported.
Navigation success criterion: no regression in session depth, with improvement as the target. The 2-week A/B on 10% traffic met both. Feed personalisation v1 ran with manual signals by design - the criterion here was generating sufficient behavioural data to spec the Phase 3 algorithm, not shipping the best feed we could. We met it. Phase 3 was better for it.
Success criterion: all 4 squads shipping from the new system before year-end. We hit it by month 3 against a 6-month projection. 500+ component variants, WCAG 2.1 AA built into the architecture rather than checked at the end.
Casual sellers and power sellers (50+ listings/month) have fundamentally different expectations from the listing experience. Building separate products wasn't viable. Progressive disclosure let us serve both - simple by default for new sellers, powerful on demand for pros - without splitting the codebase or the design system.
The homepage had accumulated competing content modules from every product team. We removed nearly a third of the content surfaces. Research showed that adding more content was reducing engagement across all content - decision fatigue is a conversion killer. Counterintuitive, but the data was clear: less got more people to act.
Developer documentation for the design system was retrofitted after adoption rather than built alongside it. Engineers had to reverse-engineer intent from components without specs, which added avoidable translation work in the first cycle. Adoption speed was a genuine success - documentation lag was the price. On the next system initiative, documentation ships in sprint, not as a retro deliverable.
The redesign delivered measurable improvement across supply, demand, conversion, retention, and operational efficiency. The DAU lift was the strongest single-year platform improvement since the launch of social selling features. Supply-side gains held through the following two quarters.
Average listing time dropped from 4.2 minutes to 156 seconds. For a power seller listing 50+ items a month, that's hours recovered each week - and the most direct driver of the seller retention improvement.
Fewer users hitting dead ends on listing, navigation, and onboarding. Support volume is one of the most honest proxies for experience quality - and one of the few metrics that can't be spun.
All 4 squads live within 3 months against a 6-month target. Design-to-development cycle time and QA defect rates dropped in the first cycle after adoption. The system became the shared foundation for every product build that followed.
The original brief called for a "visual refresh and UX improvements." In the first scoping week, I rewrote it as a marketplace health problem - anchoring the framing to GMV impact and seller churn rather than design debt. That reframe changed who attended the kickoff (CPO joined instead of just PM leads), what "done" looked like (business outcomes, not shipped screens), and how much design authority over sequencing we had throughout the year. A design brief invites feedback on screens. A business case invites alignment on strategy.
Design systems often get deprioritised because they read as internal design work. I presented this alongside the product roadmap with a business case - cycle time reduction, QA defect rate, squad consistency. When the CFO understands why a component library reduces engineering cost, it stops being a design ask and becomes a platform investment.
On a 30-person cross-functional team, verbal alignment degrades quickly. I started documenting every major design decision immediately - what we decided, what we considered, what data informed it. That log became the reference point when stakeholders revisited decisions, when new team members joined, and when engineering needed to understand intent. Consensus-building is a design discipline.
We sequenced supply (listing) before demand (feed) because it felt safer to prove one thesis before funding the next. In practice, the two tracks were run by largely independent teams - the dependency was in the planning, not the execution. Running them in parallel would have generated six months of additional behavioural data from the demand side, which would have made the Phase 2 personalisation investment significantly better-informed. The sequencing wasn't driven by capacity constraints; it was driven by a risk-aversion model that didn't hold up on closer inspection.
The brief reframe in week one was the highest-leverage design decision on the project. Everything else followed from that.
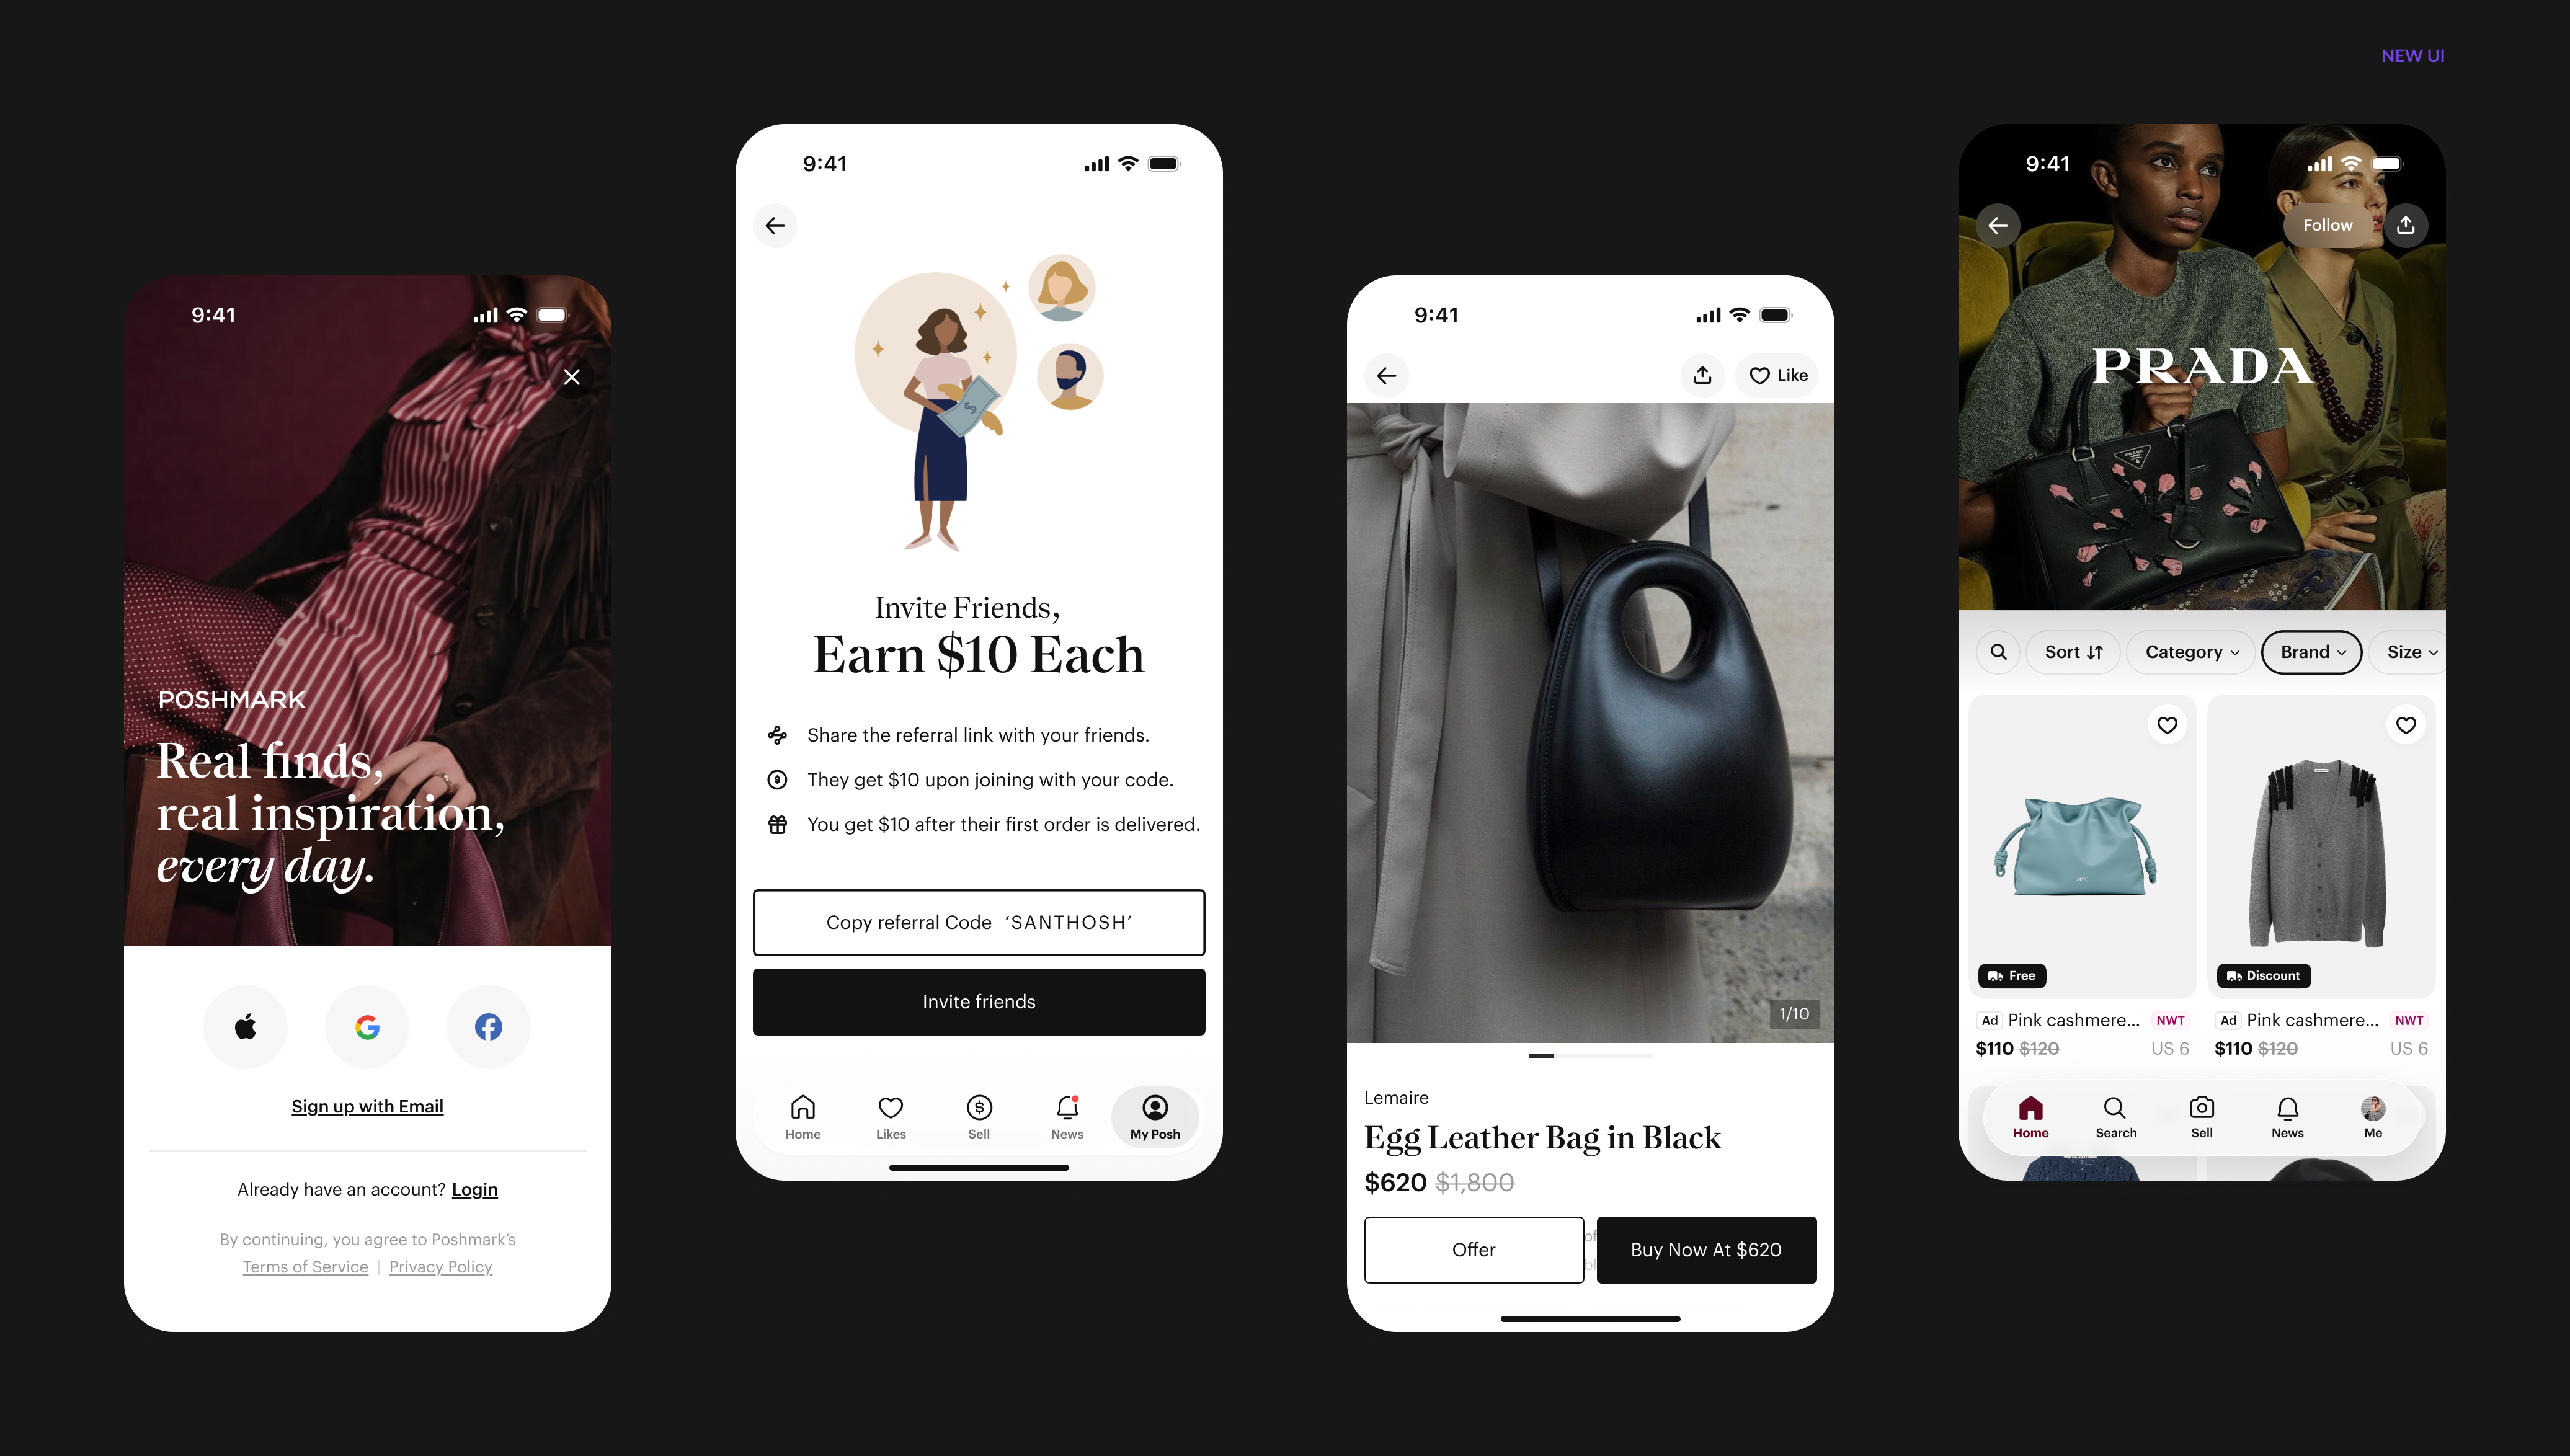
The complete Poshmark 2.0, every flow, every screen, shipped.